Inside Australia’s Renovation Boom: The Council Areas Spending Big, and Where It’s Slowing Down

Some parts of Australia are pouring tens of millions into renovations every single month, while others have fallen sharply behind. We wanted to know exactly where the country’s renovation boom is happening, and where it has stalled, so we ran the numbers.
Our Renovation Boom study ranks Australian local government areas (LGAs) using five years of Australian Bureau of Statistics (ABS) Building Approvals data, covering the 2021/22 to 2025/26 financial years. We looked at the average and total monthly value of approved renovation work in each council area, then paired that with our own anonymised sales data to see what it means for how Australians furnish their homes once the tools are placed down.
A Renovation Market Moving at Different Speeds
Nationally, the value of approved renovation work climbed by around 27% over the five years, from roughly $12 billion to $15.3 billion. That growth isn’t spread evenly. Some council areas are approving tens of millions of dollars in renovation work every month and still climbing, while others, including one of the country’s biggest cities, have gone into reverse.
Sam Cain, Operations Manager at The Furniture Trader, says:
“What we’re seeing in areas like Brisbane, Northern Beaches and the Gold Coast is a renovation market moving at completely different speeds compared to other parts of the country. Some council areas, like Brisbane and the Gold Coast, are approving tens of millions in renovation work every month and still rising, while others have shown a stark decline over the same five-year period.
“Renovation demand isn’t just about where people can afford to renovate; it’s about where the housing stock still has room to grow into. Wherever the renovation is happening, though, we’re seeing the same pattern: the furniture budget gets left until last, when it should be part of the renovation plan from day one.”
Australia’s Top 10 Renovation Hotspots
Queensland and New South Wales dominate the national top 10, together accounting for seven of the ten highest-ranking council areas, alongside three Victorian LGAs clustered around inner Melbourne and the Mornington Peninsula. Brisbane, Gold Coast and Sunshine Coast, all in South-East Queensland, collectively approved more than $136.5 million in renovation work every month over the five-year period.
|
Rank |
LGA |
State/territory |
Five-year average approved value per month (AUD) |
Five-year total approved value (AUD) |
|---|---|---|---|---|
|
1 |
Brisbane |
Queensland |
$88,496,083 |
$5,309,765,000 |
|
2 |
Northern Beaches |
New South Wales |
$32,989,733 |
$1,979,384,000 |
|
3 |
Gold Coast |
Queensland |
$26,533,033 |
$1,591,982,000 |
|
4 |
Boroondara |
Victoria |
$25,906,650 |
$1,554,399,000 |
|
5 |
Stonnington |
Victoria |
$25,144,983 |
$1,508,699,000 |
|
6 |
Mornington Peninsula |
Victoria |
$24,180,717 |
$1,450,843,000 |
|
7 |
Sunshine Coast |
Queensland |
$21,502,083 |
$1,290,125,000 |
|
8 |
Inner West |
New South Wales |
$21,191,117 |
$1,271,467,000 |
|
9 |
Woollahra |
New South Wales |
$20,479,117 |
$1,228,747,000 |
|
10 |
Sydney |
New South Wales |
$16,048,767 |
$962,926,000 |
* Sourced from ABS Building Approvals data (FY2021/22–FY2025/26). Five-year average approved value per month: Total approved value FY2021/22-FY2025/26 divided by 60 months, in Australian dollars. Five-year total approved value: The sum of approved value across all five financial years, in Australian dollars.
1. Brisbane, Queensland
Brisbane has been crowned Australia’s renovation capital, with an average of $88.5 million in residential renovation work approved every month over the past five years, and a five-year total of more than $5.3 billion, the highest of any council area in the country. Brisbane has also recorded the nation’s biggest jump in renovation activity, with approved value climbing 71.7% between 2021 and 2026, from $73.5 million to $126 million a month.
2. Northern Beaches, New South Wales
The Northern Beaches ranks second nationally, with an average of nearly $33 million in renovation work approved every month, and a five-year total of almost $1.98 billion. Unlike Brisbane’s rapid acceleration, the Northern Beaches’ renovation activity has stayed consistent, edging up just 6.1% over the five-year period.
3. Gold Coast, Queensland
The Gold Coast takes third place with an average of $26.5 million approved renovation every month, and a five-year total of almost $1.6 billion. The Gold Coast has posted the third-largest increase in renovation value nationally, up 32.9%, from $23.81 million to $31.6 million a month between 2021 and 2026, a rise that places it alongside Brisbane and Sunshine Coast as one of three South East Queensland council areas riding the same wave of renovation demand.
4. Boroondara, Victoria
Boroondara, the inner-Melbourne LGA covering Camberwell, Kew, Hawthorn and Balwyn, ranks fourth with an average of $25.9 million in approved renovation value a month, and a five-year total of more than $1.55 billion. Renovation activity here has grown steadily rather than spiked, up 24.8% over the five years to $30.3 million a month in FY2025/26.
5. Stonnington, Victoria
Stonnington rounds out the top five with an average of $25 million approved in renovation work every month, and a five-year total of more than $1.5 billion. Home to Toorak, South Yarra and Prahran, Stonnington is one of Melbourne’s smallest and most affluent municipalities by area, yet still ranks among the nation’s biggest renovation markets in dollar terms. Approved value climbed 14.1% over the five years, from $22.3 million to $25.4 million a month. Though FY2025/26 eased back from a FY2024/25 peak of $330 million for the year, a sign the market may be settling after several years of strong renovation growth.
Where Renovation Activity Is Slowing Down in Aus
The renovation boom isn’t universal. Sydney shows the clearest example of the divide: despite ranking 10th nationally for highest average approved renovation value, it recorded the country’s largest decrease in approved renovation value of any council area, down $6.6 million a month on average, a drop of 29.1%, between 2021 and 2026.
|
Rank |
LGA |
State/territory |
FY2021/22 average per month (AUD) |
FY2025/26 average per month (AUD) |
Absolute monthly change (AUD) |
Percentage change |
|---|---|---|---|---|---|---|
|
1 |
Sydney |
New South Wales |
$22,835,417 |
$16,187,167 |
-$6,648,250 |
-29.1% |
|
2 |
Ku-ring-gai |
New South Wales |
$12,097,000 |
$9,505,083 |
-$2,591,917 |
-21.4% |
|
3 |
Northampton |
Western Australia |
$2,574,000 |
$190,833 |
-$2,383,167 |
-92.6% |
|
4 |
Glen Eira |
Victoria |
$12,765,750 |
$10,781,500 |
-$1,984,250 |
-15.5% |
|
5 |
Australian Capital Territory (no constituent LGAs) |
Australian Capital Territory |
$8,400,667 |
$6,649,333 |
-$1,751,333 |
-20.8% |
|
6 |
Kingston |
Victoria |
$6,939,417 |
$5,375,417 |
-$1,564,000 |
-22.5% |
|
7 |
Manningham |
Victoria |
$5,690,500 |
$4,263,583 |
-$1,426,917 |
-25.1% |
|
8 |
Rockhampton |
Queensland |
$4,799,500 |
$3,495,833 |
-$1,303,667 |
-27.2% |
|
9 |
Yarra Ranges |
Victoria |
$7,886,000 |
$6,880,750 |
-$1,005,250 |
-12.7% |
|
10 |
Hobart |
Tasmania |
$3,461,333 |
$2,599,333 |
-$862,000 |
-24.9% |
*FY2021/22 average per month (AUD): FY2021/22 approved value divided by 12 months, in Australian dollars. FY2025/26 average per month (AUD): FY2025/26 approved value divided by 12 months, in Australian dollars. Absolute monthly change (AUD): FY2025/26 monthly average minus FY2021/22 monthly average, in Australian dollars (negative = decrease). Percentage change: Percentage change from FY2021/22 to FY2025/26 annual value.
The next largest falls were concentrated in Sydney’s north (Ku-ring-gai, down 21.4%) and several inner and middle-ring Melbourne council areas, including Glen Eira (down 15.5%), Kingston (down 22.5%) and Manningham (down 25.1%). Northampton in Western Australia (down 92.6%) and Rockhampton in Queensland (down 27.2%) also recorded steep declines from a much smaller base.
Furnishing a Post-Renovation Home
We want to help Australian homeowners plan the furniture side of a renovation, not just the build. As far as we’re concerned, a renovation isn’t finished the day the builders leave; it’s finished the day a room is properly furnished.
Sam Cain, Operations Manager at The Furniture Trader, says:
“This data confirms what we’re seeing at the till every day. Renovation activity isn’t happening at the same pace everywhere; some areas are approving millions in renovation work every month, while others have shown a steep decline over the same five-year period. But wherever a renovation is happening, the same question follows: what do you furnish, and in what order?”
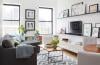
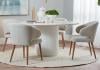
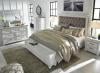
“Based on our internal data, lounges or living areas come first: sofa suites and coffee tables are consistently our biggest sellers, likely because that’s the space families want to enjoy straight away. Bedroom furniture follows closely behind, then dining.
“The biggest mistake we see is people spending their entire budget on the renovation itself and treating furniture as an afterthought. If you’ve opened up or extended a living space, the scale of the room changes completely, and furniture that worked in the old layout can suddenly look lost or crowded. We always tell customers to budget for furniture as part of the renovation timeline, not after it, and to think about how new pieces will sit alongside what they’re keeping, so the finished home doesn’t feel like two different houses stitched together.”
How We Ran the Numbers
Our Renovation Boom study is based on ABS data on approved residential building work, covering alterations and additions across all Australian council areas from July 2021 to June 2026. We ranked LGAs by the highest and lowest average monthly approved renovation value, and the largest increases and decreases in approved renovation value between the first and last financial years covered, then paired the results with our own anonymised sales data. Figures are shown in current Australian dollars and haven’t been adjusted for inflation or for differences in council size and population, so larger consolidated councils naturally show bigger totals in dollar terms. These figures represent approved renovation value, not confirmed spending or completed work.
Furnishing Australia’s Next Renovation Locally
Wherever you are in Australia, whether your council area is in the middle of a renovation boom or just getting started, the same rule applies: furniture should be part of the plan from day one, not an afterthought once the dust settles. As a family-owned Australian retailer with over 30 years in the business and showrooms in Epping, Dandenong, Hoppers Crossing and Burnside, we’ve helped furnish plenty of freshly renovated homes, and we know how quickly the wrong furniture can make a new space feel wrong.
If you’re partway through a renovation, or just starting to plan one, come and see our range in-store or browse our furniture collections online. We’ll help you furnish your new space properly, from the lounge room to the bedroom and beyond.
About the Author